What is Code Analyzer ?
This is basically a sort of framework that clones a repo from GitHub and tests the code within it and returns the time and space used by the code. The code in the repo should be in a particular format i.e the code should be written in test.py file , The code to be analyzed should be written inside class name called Testing and should contain code within setup function with params as parameters to the function.
What is Python Code Analyzer ?
Python code inspection is a difficult subject, as any experienced software developer will tell you. It’s critical to keep checking code and proving that program works. At each step of development, it’s critical to ensure that software is testable, readable, and maintainable. Pylint is perhaps the most used Python code analyzer for helping to improve program code and determine if it meets standards. In our previous blog we discussed about how to make make your own AI powered game
Motivation
As I was searching for a tool that analyzes a particular format of python codes and return their time complexity and peak memory used, But found out there were no such thing. So why not make one yourself. In this blog I will explain every piece of code and trouble I faced when making my own analyzing sort of framework.
Lets Get Into The Code (The Fun Part)
So as I was brainstorming I came to a conclusion that the system needs 3 part :
- one that clones the repo only from GitHub
- second it should analyze the validity of the module
- giving the cloned code some type of score according to the resources used
Cloning
import os
import shutil
from os import path
import urllib3
import subprocess

class RepoClone:
    """
    Class to clone repos from github
    """
    def __init__(self, url):
        """
        Initializing the instance
        :param url: url of the desired repo must be HTTPS not SSH
        """
        self.url = url
        self.path = str(os.getcwd() + '/temp/')

    def __check_path__(self):
        if path.exists(self.path):
            shutil.rmtree(self.path)
        else:
            os.mkdir(self.path)

    def clone(self):
        """
        :return: if the clone is success returns true otherwise false
        """
        self.__check_path__()
        url_check = urllib3.connection_from_url(self.url)
        # checking if the host is github or not
        if url_check.host == 'github.com':
            try:
                var = subprocess.run(["git", "clone", self.url, self.path], check=True, stdout=subprocess.PIPE).stdout
                # os.system('git clone ' + self.url + ' ' + self.path)
                return True
            except subprocess.CalledProcessError:
                return False
        else:
            return False
The main objective of this class is to clone the provided repo, if the provided URL is valid. To do this we firstly check if it is a valid URL. What I did was , I sent a request to that URL and if it sends a success code then we check is was it from GitHub or not. If the reply was given from the valid host i.e ‘GitHub’ then we try to clone the repo into some temporary directory. While making this I came to know that os.system() exceptions are not handled by expect function so we need to create a sub process and redirect the output pipeline to standard IO. This way if any error arises it gets detected and is handled by the system itself. So if the repo is cloned successfully this class returns True otherwise False. Now we have a class that clones from a valid host next is to analyze the validity of code in the repo.
Validating:
from GithHubClone import RepoClone
import os


class ModuleChecker:
    """
    Clones the repo url passed in
    makes the folder to a python module
    checks if the module has test.py file and Testing class
    """
    def __init__(self, url):
        self.path = os.getcwd() + '/temp/'
        self.url = url
        self.repo = RepoClone(url=self.url)

    def clone_check(self):
        """
        only adds __init__.py file to the folder
        to make the folder to be read as a module
        :return: True If It Fulfills all mentioned condition
        """
        status = self.repo.clone()
        if status:
            file = open(self.path + '__init__.py', 'x')
            file.close()
            check_status = self.__test_module__()
            return check_status
        else:
            return False

    def __check_file__(self):
        """
        :return: True if test.py file exists and False if not
        """
        try:
            file = open(self.path + 'test.py')
            file.close()
            return True
        except IOError:
            return False
        finally:
            file.close()

    def __test_module__(self):
        """
        check overall structure of the folder
        i.e Must have test.py file and Testing class
        :return: True if both condition matches and False if not
        """
        if self.__check_file__():
            try:
                # enusre the class in the file is Testing
                from temp.test import Testing
                return True
            except Exception as e:
                return False
        else:
            return False
I used some innovative technique to check if the provided python code is valid or not. We all know how to import a module in python. Rather than executing the code we make the cloned code as a module so in this way if the module is imported only valid code is imported otherwise there will be an exception raised and we could say that the code in the repo is not valid. Since I don’t have much knowledge about how algorithms are tested in real case scenarios this is my crud version of testing the validity of the code. So if the module has test.py file and Testing class then the given repo is valid otherwise not. So this class does the same thing, First it clones the repo if the repo is valid it adds __init__.py file so that it can be treated as a module in python. Then it checks if there is any test.py files within the repo. If there is any then it tries to import the class named Testing . If the class is imported successfully then it has valid code within it otherwise an exception is raised. So till now we have a class that clones and validates the code. All we need is now to analyze the code. This was the tricky part but some how I managed to figure it out.
Analyzing:
import timeit
from ModuleChecker import ModuleChecker
import os
import io
import pandas as pd
import tracemalloc
from os import path
import shutil
import matplotlib.pyplot as plt
__REPEAT__ = 5
__NUMBER__ = 1000
__SAVE_PATH__ = os.getcwd()
class Benchmark:
"""
Benchmarking python codes
Completeness
Correctness
Time Complexity
Peak Memory Usages
Detailed Function Profiling
"""
def __init__(self, url, expected_output, params):
"""
:param url: Url To Be Cloned or Github repository HTTPS Link SSH Is Not Supported
:param expected_output: Actual output generated by the algorithm
:param params: Parameters For Function Testing
"""
self.url = url
self.repo_validity = ModuleChecker(self.url).clone_check()
self.benchmark_score = {"complete": False, "correctness": True, "time": None, "memory": None,
"detailed_profiling": None}
self.target_output = expected_output
self.calculated_output = None
self.params = params
def start(self):
"""
:return: False if the given repository link is not valid otherwise returns the defined complexities score
"""
if self.repo_validity:
self.__completeness__()
self.remove_temp()
return self.benchmark_score
else:
self.remove_temp()
return False
def __time_complexity__(self):
"""
Measures the time taken by the code to execute for __REPEAT__ times
:return: None
"""
params = self.params
setup_code = "from temp.test import Testing"
stmt_code = "Testing.setup(" + str(params) + ")"
time = timeit.repeat(stmt=stmt_code, setup=setup_code, repeat=__REPEAT__, number=__NUMBER__)
self.benchmark_score['time'] = time
def __space_complexity__(self):
"""
Measures the peak memory used by the defined function
:return: None
"""
from temp.test import Testing
tracemalloc.start()
Testing.setup(self.params)
current, peak = tracemalloc.get_traced_memory()
tracemalloc.stop()
self.benchmark_score['memory'] = peak / 10 ** 6
def __completeness__(self):
"""
Checks if the given module provides any output or not
:return: None
"""
from temp.test import Testing
result = Testing.setup(self.params)
if result is not None:
self.benchmark_score["complete"] = True
try:
assert result == self.target_output
self.benchmark_score["correctness"] = True
self.__time_complexity__()
self.__detailed_profiling__()
self.__space_complexity__()
except AssertionError:
self.benchmark_score["correctness"] = False
def __test__(self):
"""
Testing the downloaded module
:return: None
"""
from temp.test import Testing
a = Testing.setup(self.params)
def __detailed_profiling__(self):
"""
Using cProfile to aggregate the resources used by the function
:return: None
"""
import cProfile, pstats
profiler = cProfile.Profile()
profiler.enable()
self.__test__()
profiler.disable()
stream = io.StringIO()
pstats.Stats(profiler, stream=stream).sort_stats('ncalls').strip_dirs().print_stats()
stream = stream.getvalue()
self.__convert_to_csv__(stream)
self.benchmark_score['detailed_profiling'] = pd.read_csv(os.getcwd() + '/temp/stat.csv')
@staticmethod
def __convert_to_csv__(stream):
"""
Converting crpofile output to csv
:param stream: IOStram for the cprofile output
:return: None
"""
result = 'ncalls' + stream.split('ncalls')[-1]
result = '\n'.join([','.join(line.rstrip().split(None, 5)) for line in result.split('\n')])
f = open(os.getcwd() + '/temp/stat'.rsplit('.')[0] + '.csv', 'w')
f.write(result)
f.close()
def remove_temp(self):
"""
Removes the temporary files after results are calculated
:return: None
"""
if path.exists(os.getcwd() + '/temp/'):
shutil.rmtree(os.getcwd() + '/temp/')
def visualize(self, params='time', save=False):
if self.benchmark_score['complete'] is True:
if params == 'time':
self.__visualize_time__(save)
elif params == 'cprofile':
self.__visualize_cprofile__()
elif params == 'all':
self.__visualize_time__(save)
self.__visualize_cprofile__(save)
def __visualize_time__(self, save=False):
plt.bar(range(1, 6), self.benchmark_score['time'])
plt.title('Time Complexity for 5 Iterations')
plt.ylabel('Time In Seconds')
plt.xlabel('No Of Iterations')
if save:
plt.savefig(__SAVE_PATH__ + '/time.png')
plt.show()
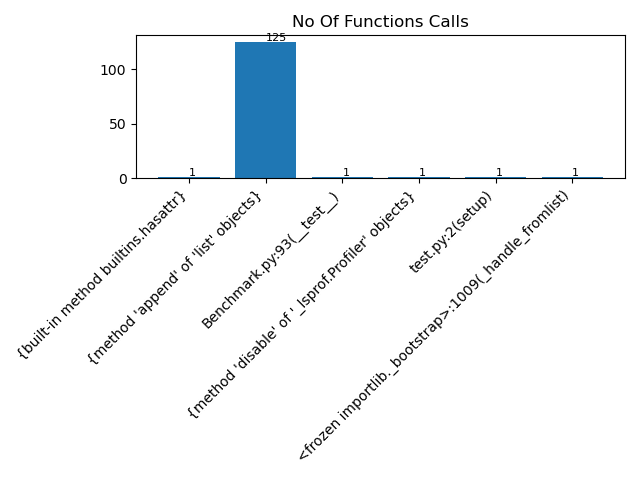
def __visualize_cprofile__(self, save=False):
score = pd.DataFrame(self.benchmark_score['detailed_profiling'])
ncalls = score.iloc[:, 0]
functions = score.iloc[:, -1]
plt.bar(functions, ncalls)
plt.title('No Of Functions Calls')
plt.xticks(rotation=45, ha="right")
for index, data in enumerate(ncalls):
plt.text(x=index, y=data + 1, s=f"{data}", fontdict=dict(fontsize=8))
plt.tight_layout()
if save:
plt.savefig(__SAVE_PATH__ + '/function_calls.png')
plt.show()
In the process of analyzing given code I divided the problem into four parts.
- If the given code produces any output so that it could be labeled as complete i.e produce anything
- If the code is complete then does the code give correct result.
- If the code is complete and correct analyze the time taken to execute and memory used by the code
- Finally visually represent the results so that it would be easier to understand
For checking if the code gives any output we just run the code and store the returned value to a variable and if the variable is not None then we can say that it gives some output .
If our code is complete we check if the output provided by the function matches the expected result. So as we all know assert function checks if any two variables uses same memory location. Why this? the intuition behind this is that python does not create redundant memory location. It just create a reference to the memory location so we can say that if two variable shares same memory location then they have same value within them. So correctness is checked all it remains it to check the time taken to execute and compute the peak memory location. This was fairly easy as python already had function for this purpose.
To generate the time taken by the code execution I used timeit function provided by python itself. All I did was run the code within the repo inside timeit and rest is handled by timeit itself. Since time to execute a piece of code is constant as the background process , current cpu load and all other factors kicks in . To find the sweet spot all I did was to run the code 5 times iteratively and see the result.
To calculate the memory used by the code all I did was use tracemalloc. When executing code within this it gives us current memory used and the peak memory used by the code. So I just picked the peak memory and labeled it as the maximum memory used by the code.
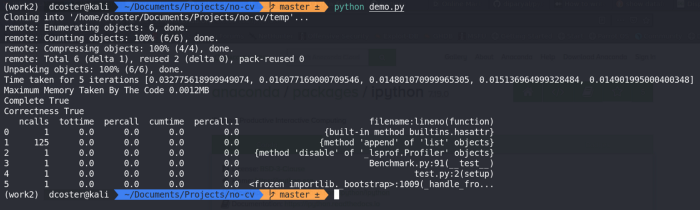
Moreover I encountered a tool named cProfile in python. I was really excited to see how this tool helped to see the number of function calls , Cumulative time taken and many more. I just incorporated it in my code so we have much better understanding of the code executed. So just ran the code within cProfile and save the bytestram as csv then load it as a dataframe so we could have fun with pyplots .
Conclusion:
Combining this all we have a system that clones a repo from GitHub and analyzes the code within it.
Output :